Press Releases
JETNET Releases March 2017 and First Quarter 2017 Pre-Owned Business Jet, Business Turboprop, Helicopter, and Commercial Airliner Market Information
UTICA, NY – JETNET LLC, the leading provider of corporate and commercial aviation intelligence, has released March 2017 and first quarter 2017 results for the pre-owned business jet, business turboprop, helicopter, and commercial airliner markets.
Market Summary
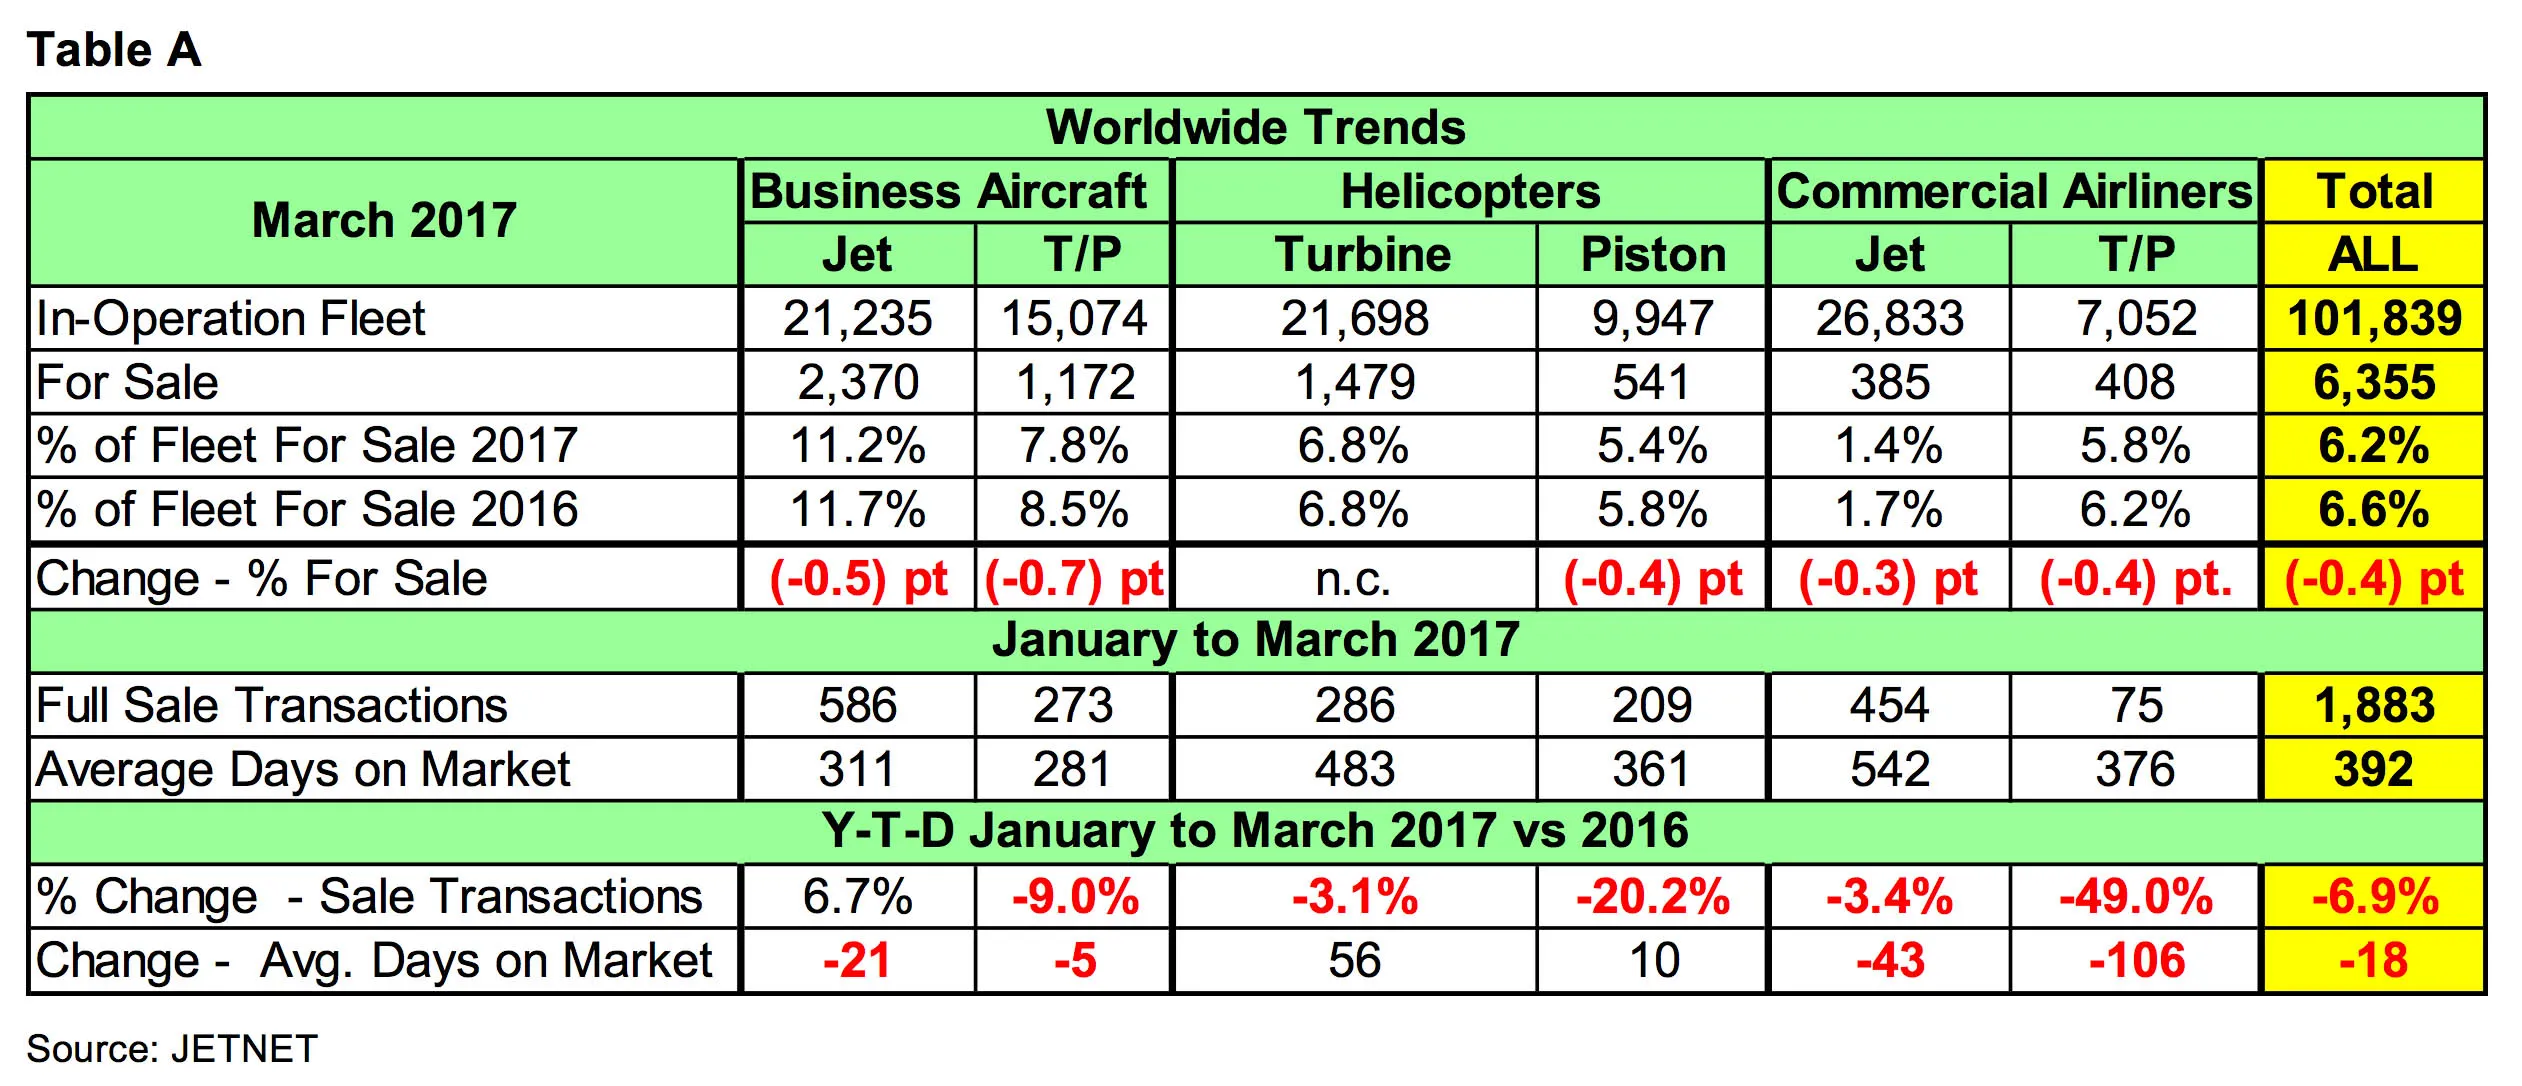
Highlighted in Table A are key worldwide trends across all aircraft market segments, comparing March and 1st quarter of 2017 to March and 1st quarter of 2016. Generally, inventories are down across the board, except for business jets! The Business Jet market is the only market to show an increase (6.7%) in sales transactions.
Commercial turboprops and business turboprops showed the largest decrease in the for-sale numbers, with 101 and 86 fewer turboprops, respectively, at the end of the first quarter of 2017 vs. 2016. Turbine helicopters were the only segment to show an increase in for-sale numbers, up 18 from 1,461 in March 2016 to 1,479 in March 2017. Across all aircraft sectors, there were a total of 6,355 or 6.9% fewer aircraft for sale in the quarterly comparison.
Accordingly, Fleet For Sale Percentages for business jets and business turboprops showed the largest decreases of all market sectors in the quarterly comparison, of 11.2% (down .5 pt.), and 7.8% (down .7 pt.), respectively.
Business jet retail sale transactions showed a 6.7% increase, and are taking less time (21 days) to sell than last year. However, business turboprops showed a decrease of 9% in sale transactions, and are also selling in less time (5 days).
Turbine and piston helicopters saw declines in sale transactions in the first quarter comparisons, at -3.1% and -20.2%. They took more days to sell, with turbine helicopters taking 56 days, and piston helicopters 10 days.
Commercial airliners are reported by JETNET in Table A - Worldwide Trends, and include the numbers for sale for both commercial jets (including airliners converted to VIP) and commercial turboprop aircraft. Interestingly, business jets (at 586) and commercial jets (at 454) accounted for 55% of the total full sale transactions (1,883).
From this 1st quarter 2017 Market Information press release going forward, Average Asking Prices can be obtained by contacting JETNET directly to learn more about the new JETNET Values program, which is offered as an add-on product.
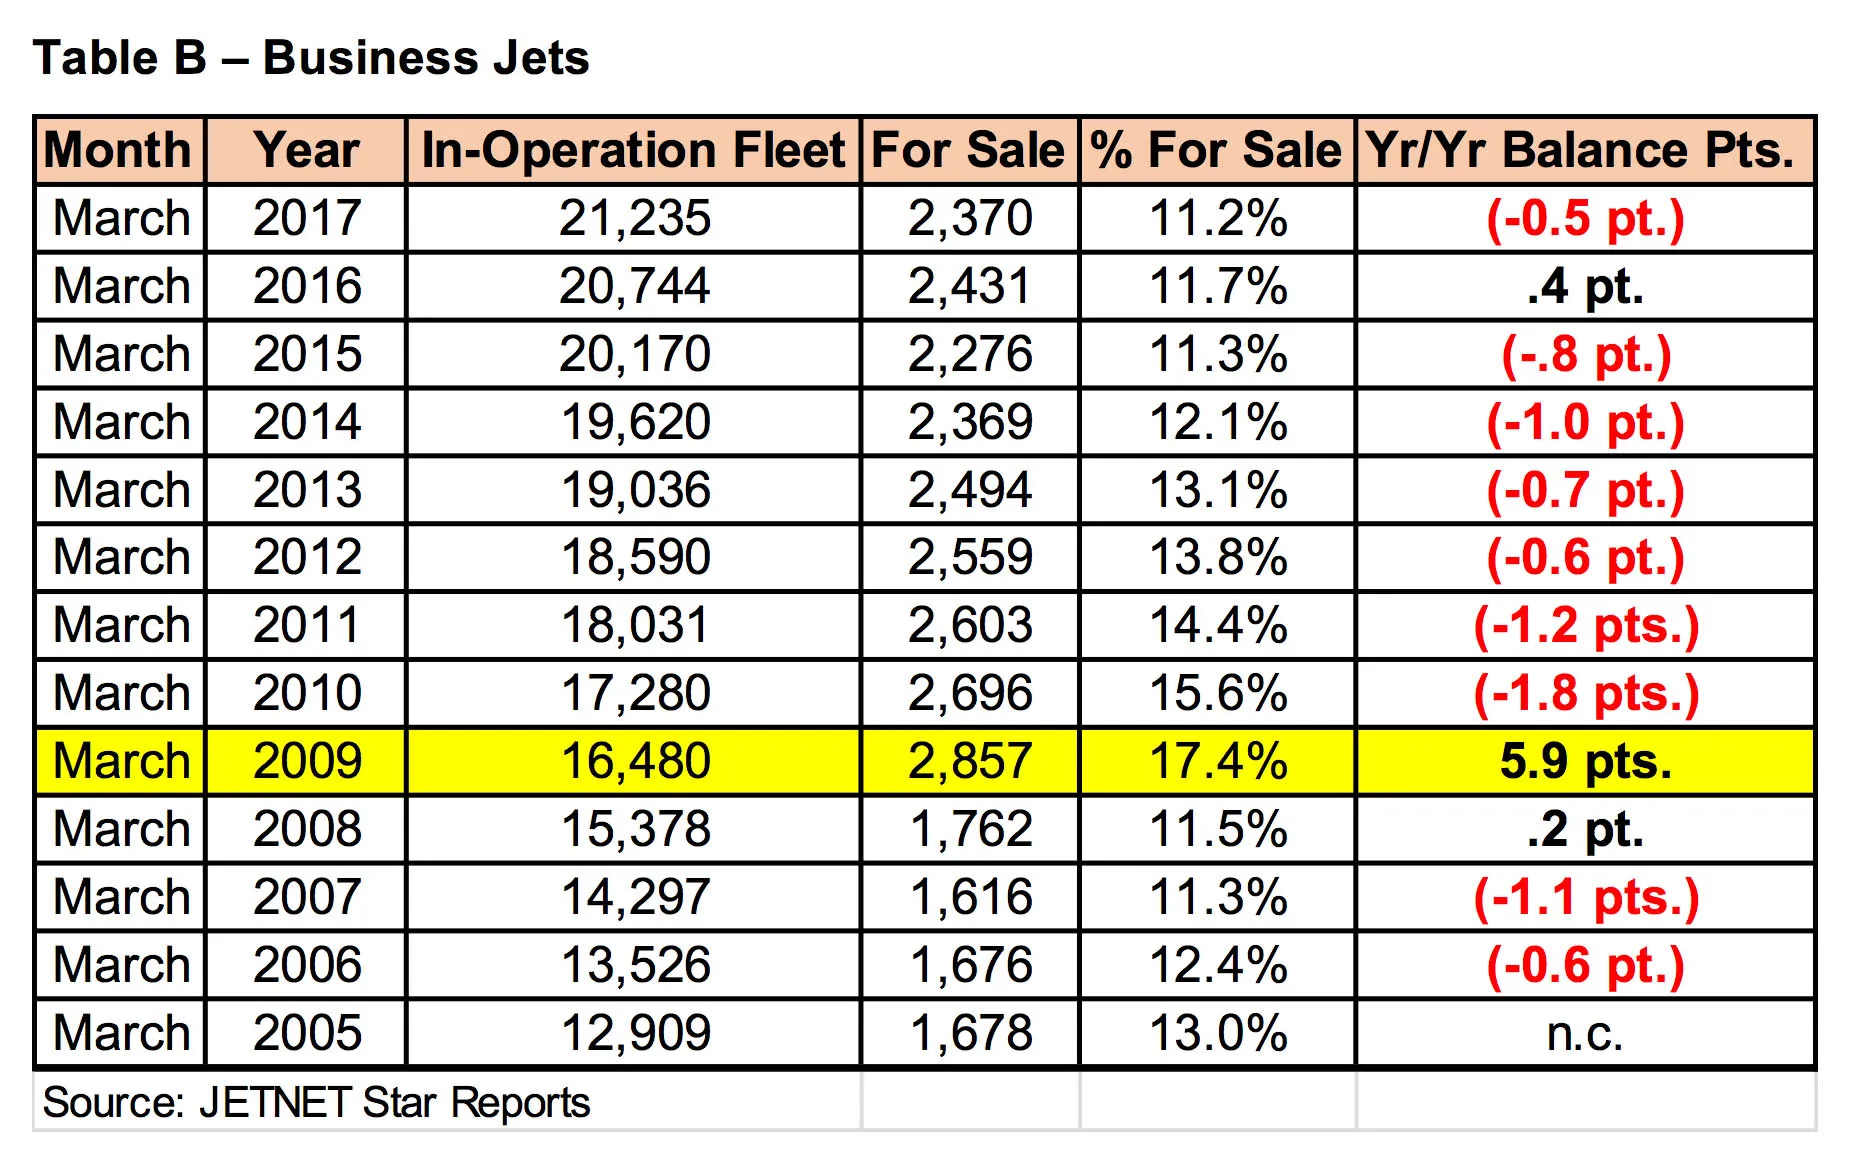
Table B shows the March-ending changes from 2005 to 2017 for the business jet in-operation fleet, number for sale, percentage for sale, and the year-over-year point change (11.2% less 11.7% equals -0.5 point decrease). March 2016 is the first March-ending period that the percentage for sale and year-over-year points have increased since March 2009 (highlighted in yellow). Interestingly, the March 2017 number of aircraft for sale (2,370) is nearly the same as that for March 2014 (2,369), but with the increase in the in-operation fleet the percentage for sale is much lower (11.2% vs. 12.1%).
In 2009, as the recession struck, there was an explosion of 62%—or 1,095—more business jets listed for sale compared to the year prior. What then followed was a six-year trend toward recovery, as the market steadily shed inventory and moved closer to again being a healthy “seller’s market”. While this decrease in units for sale is a far cry from the pronounced spike of 2009, the 1st quarter of 2017—at 11.2% the lowest since 2005—must be regarded as a positive step in the direction of a stabilized inventory for sale.
Pre-Owned Full Retail Sale Transaction Trends
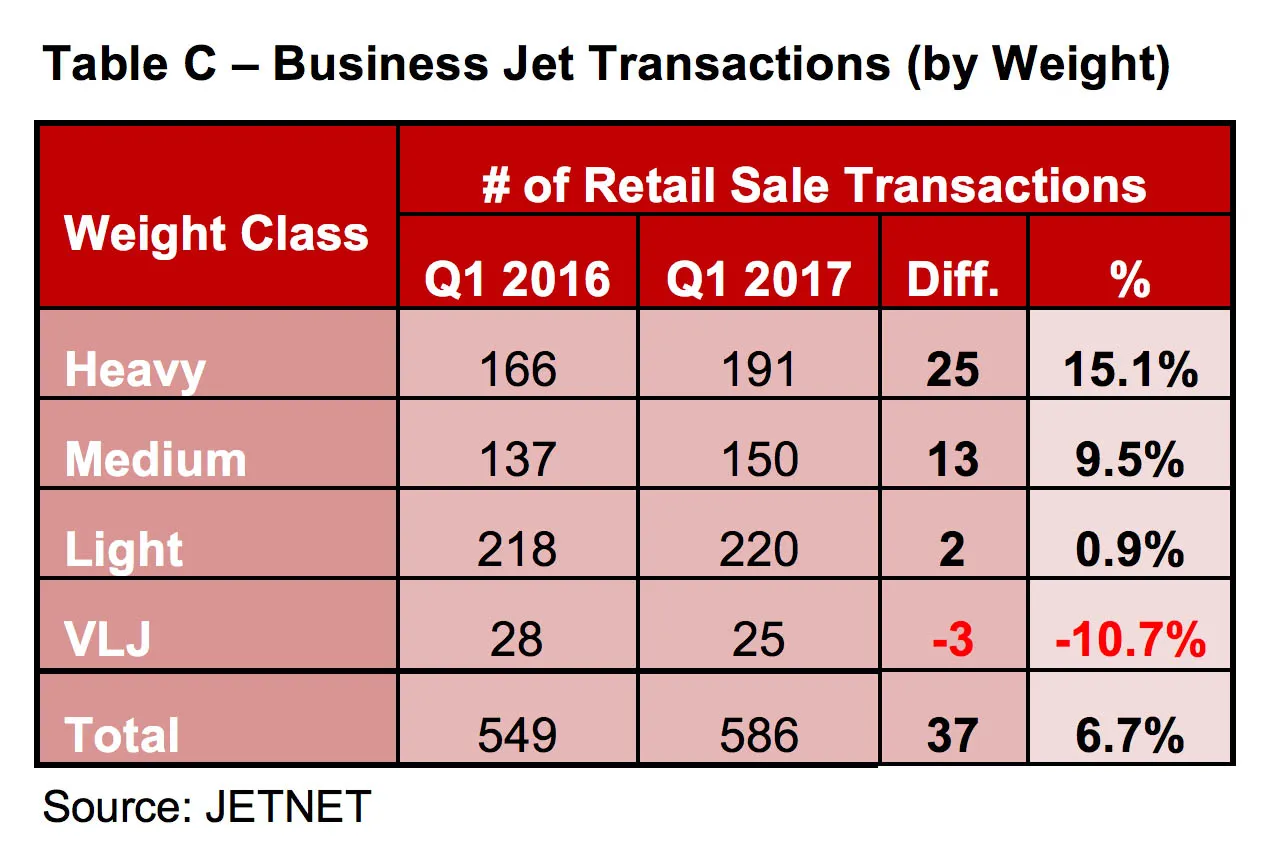
In total, there were 37 (6.7%) more business jet transactions in the first quarter of 2017 than the first quarter of 2016. The comparisons in Table C illustrate where the changes occurred by aircraft weight group.
The results were mixed by weight class when comparing the first quarters of 2017 and 2016. While the light jet weight class accounts for 38% (220 out of 586) of the total sale transactions, its change in the quarterly comparison showed a difference of only 2 more transactions. Also, the VLJ (10,000 lbs. or less) class was the only weight class to show a decline. The heavy (35,000+ lbs.) segment showed the largest increase in full retail sale transactions, up by 25 units (or 15.1%). At 191 total sales, this segment accounted for fully a third of all pre-owned retail jet transactions in Q1 2017.
U.S. GDP
From 1950 to 2000, U.S. economic growth as measured by GDP averaged 3.6% annually. But since 2000, GDP growth has been cut by half to 1.7%. Meanwhile, the world economy has been slowing down, and the expected recovery is rather shallow and surrounded by risks. Global GDP growth is expected to have reached a low point in 2016, and is projected to strengthen this year and next. Growth is projected to pick up gradually from 3.2% in 2016 to 3.7% in 2017 and 3.9% in 2018.
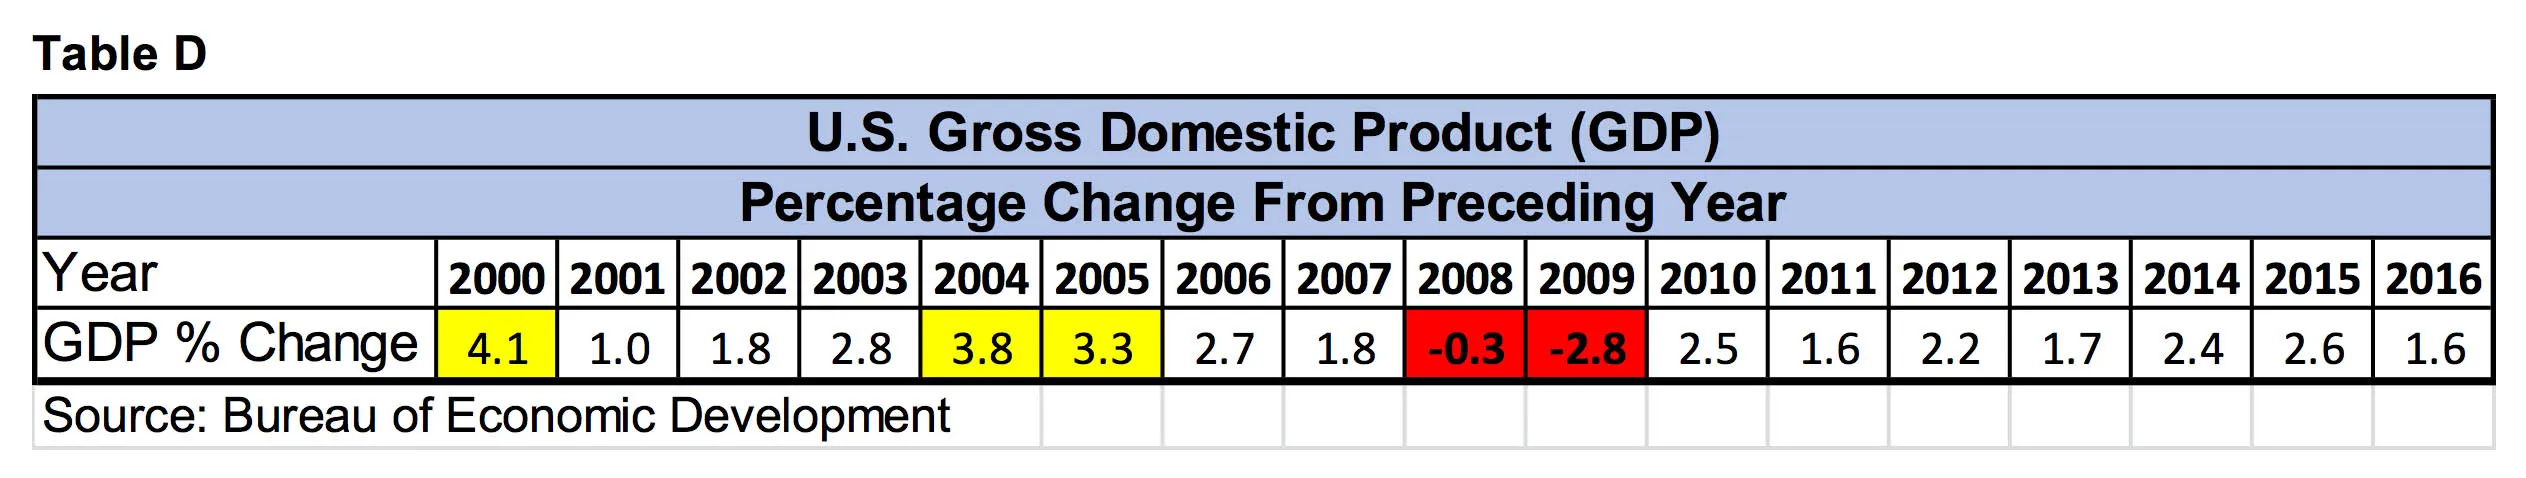
When the U.S. GDP is 3.0% or higher growth, business aviation does very well. Table D shows the U.S. GDP by year from 2000 to 2016. The years 2000, 2004, and 2005 were the only years that the U.S. GDP growth rate was 3.0% or greater annually (highlighted in yellow).
While the economy certainly seems stronger than it did last year, gross domestic product growth remains sluggish, with 2016 GDP growth at 1.6%, down from 2.6% in 2015.
Real gross domestic product—the output of goods and services produced by labor and property located in the United States—increased at an annual rate of 0.7% in the first quarter (that is, from the fourth quarter of 2016 to the first quarter of 2017), according to the “advance estimate” released by the Bureau of Economic Analysis (BEA). Accordingly, the first quarter of 2017 is off to a slow start, but the year is young.
Take A
Test Flight
Get a personalized demonstration of the world’s premier aviation intelligence platform.