Press Releases
JETNET Releases June 2017 and First Six Months of 2017 Pre-Owned Business Jet, Business Turboprop, Helicopter, and Commercial Airliner Market Information
UTICA, NY – JETNET LLC, the leading provider of corporate aviation information, has released June 2017 and the first six months of 2017 results for the pre-owned business jet, business turboprop, helicopter, and commercial airliner markets.
Market Summary
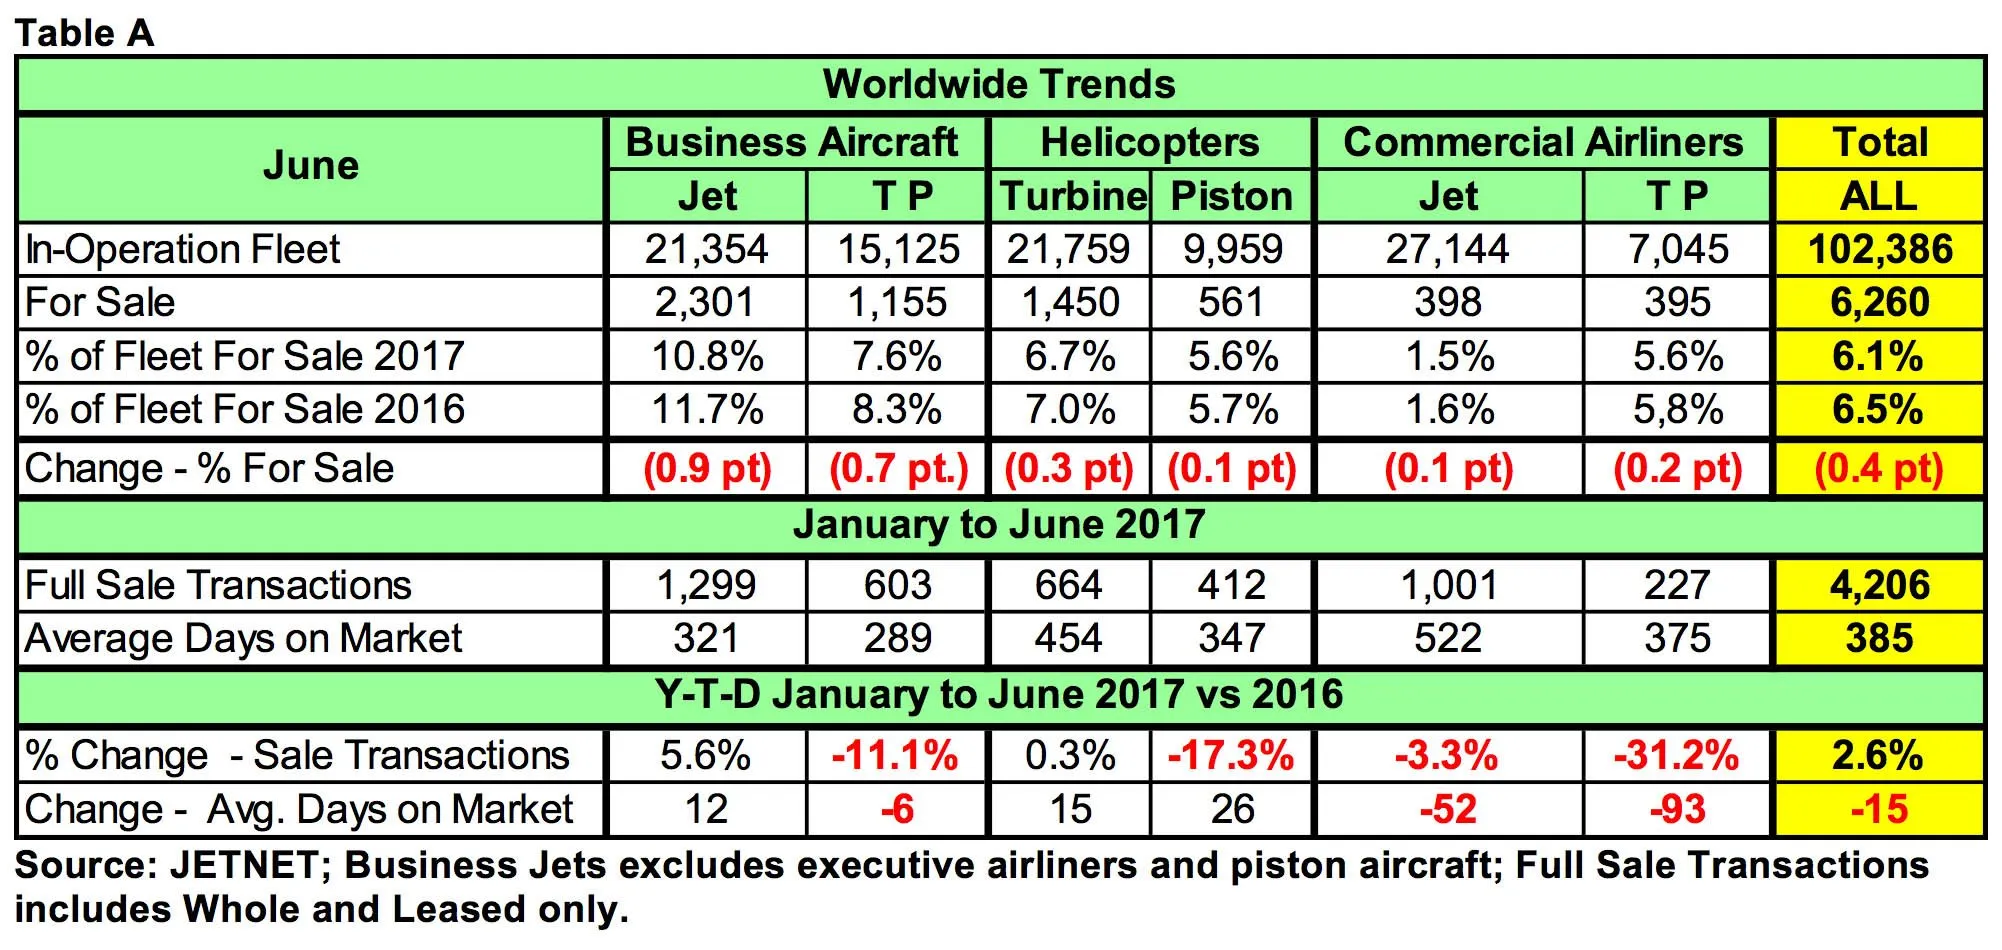
Highlighted in Table A below are key worldwide trends across all aircraft market segments, comparing June 2017 to June 2016. “Fleet For Sale” percentages for all sectors were down in the June comparisons. June 2017 was the lowest “For Sale” percentage (10.8%) for business jets that we have seen since the great recession began.
TRENDS: Generally, across all six aircraft sectors reported, inventories are down, and average days on the market improved to 15 fewer days before selling.
Business jets are showing a good start in the first six months of 2017, with a 5.6% increase in pre-owned sale transactions, but are taking more time to sell (12 days) than last year. Business turboprops decreased by 11.1% in sale transactions, while taking less time to sell (6 days).
Turbine helicopters saw a slight increase in YTD sale transactions, up 0.3%. While piston helicopters showed double digit decline of 17.3% in sale transactions, comparing June 2017 to June 2016.
Commercial airliners are also reported by JETNET in Table A - Worldwide Trends, and include the number for sale for both commercial jets (including airliners converted to VIP) and commercial turboprops. Commercial Jets and Commercial Turboprops were down in full sale transactions at -3.3% and -31.2% respectively, in the Juneover-June comparisons. Commercial turboprop YTD sale transactions are significantly lower—at 227—than any of the other market sectors for the first six months of 2017.
For the first six months of 2017 there were a total of 4,206 aircraft and helicopters sold, with business jets (1,299) and commercial jets (1,001) leading all types and accounting for 55% of the total. The number of sale transactions across all market sectors— at 4,101—increased by 2.6% compared to the first six months of 2016. Only business jets and turbine helicopters showed increases in sale transactions compared to the other market sectors.
Global, USA, and Non-USA Pre-owned Market Trends
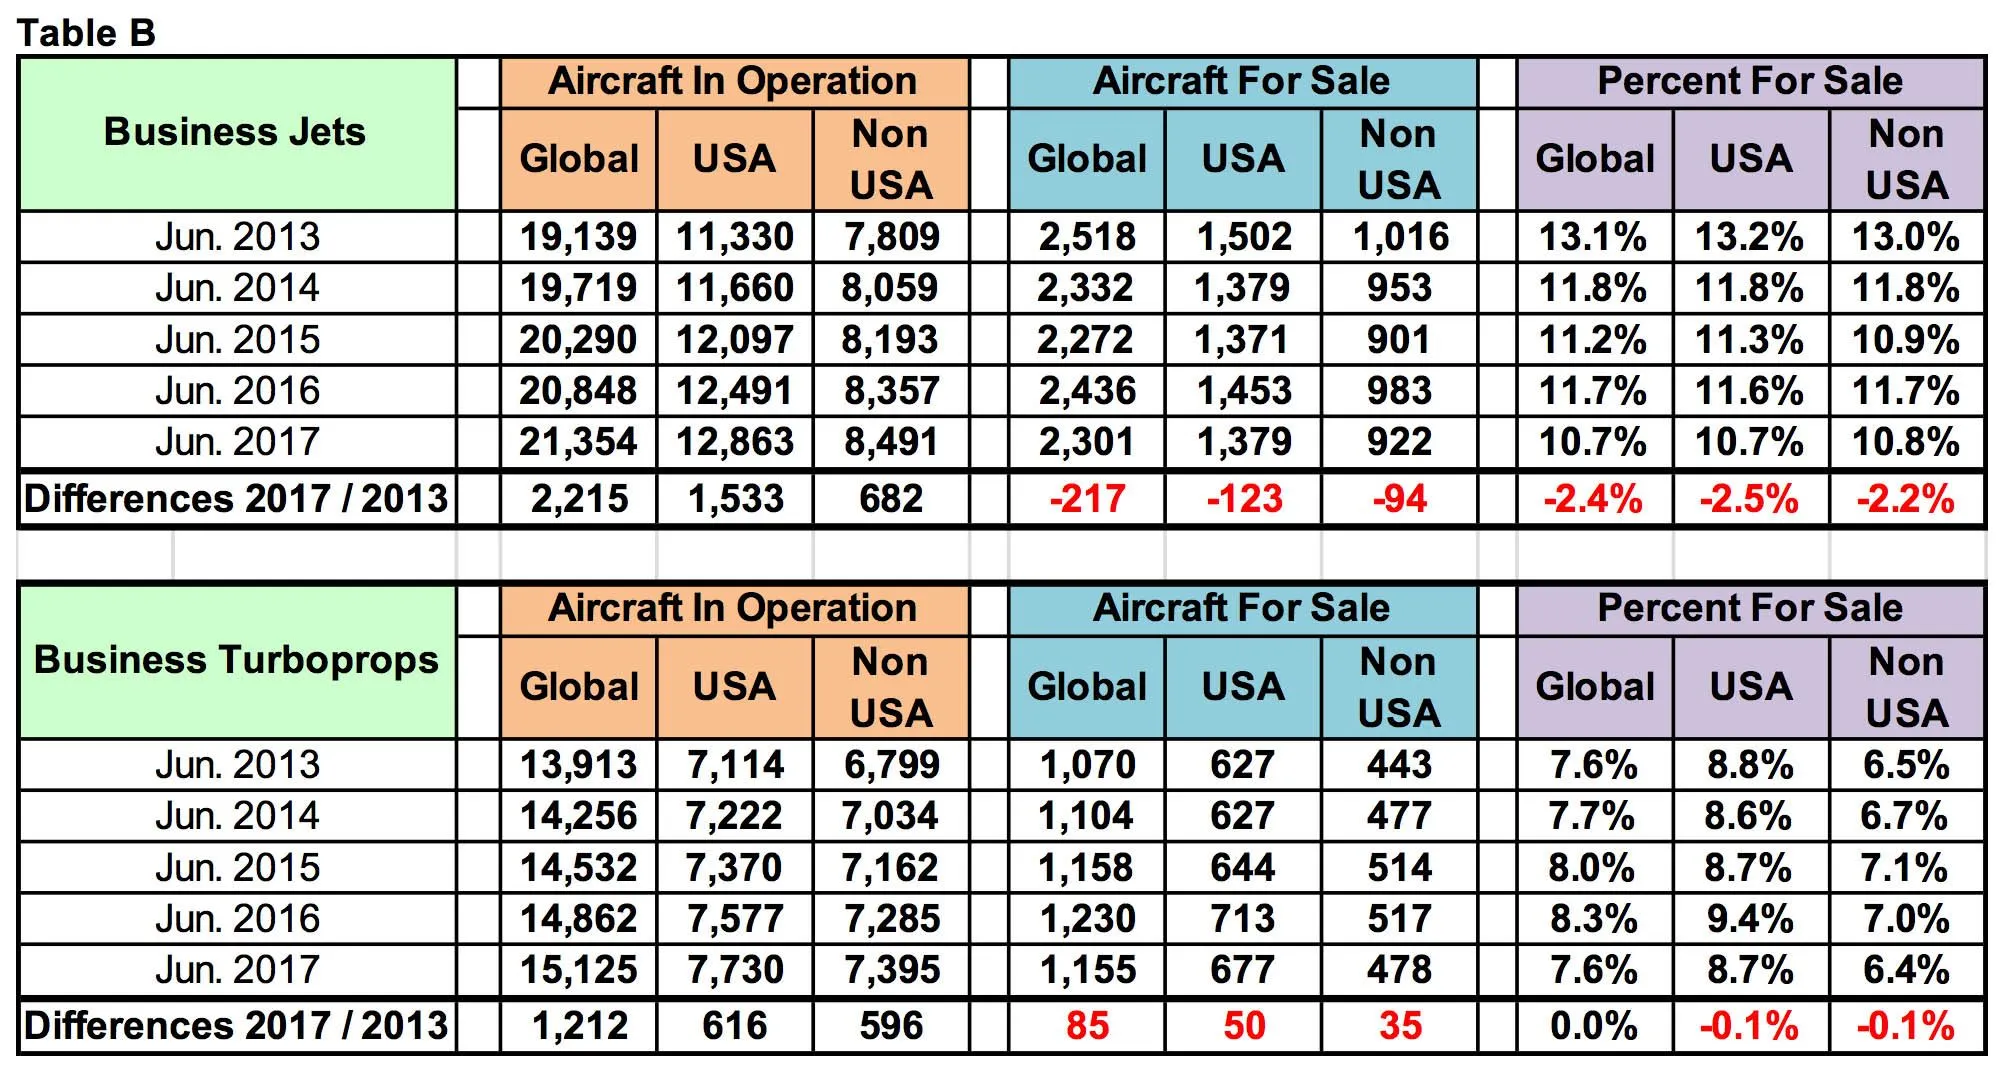
Highlighted in Table B are business jets and business turboprops, comparing the months of June from 2013 to 2017 for the U.S. vs. Non-U.S. aircraft in operation, for sale, and percentage for sale.
The general trend is that the number of in-operation business jets, which has grown by 2,215, has almost doubled compared to business turboprops, which have grown 1,212 since 2013. The number for sale and percentage for sale have declined since 2013. The split between U.S. vs. Non-U.S. for business jets has remained at 60/40 levels, whereas the business turboprops split of in-operation U.S. vs. Non-U.S. is about 50 /50, while the numbers for sale are 59/41 in favor of the U.S.
Take A
Test Flight
Get a personalized demonstration of the world’s premier aviation intelligence platform.