Press Releases
JETNET Releases June 2018 and First Six Months of 2018 Pre-Owned Business Jet, Business Turboprop, Helicopter, and Commercial Airliner Market Information
UTICA, NY – JETNET LLC, the leading provider of aviation market information, has released June 2018 and the first six months of 2018 results for the pre-owned business jet, business turboprop, helicopter, and commercial airliner markets.
Market Summary
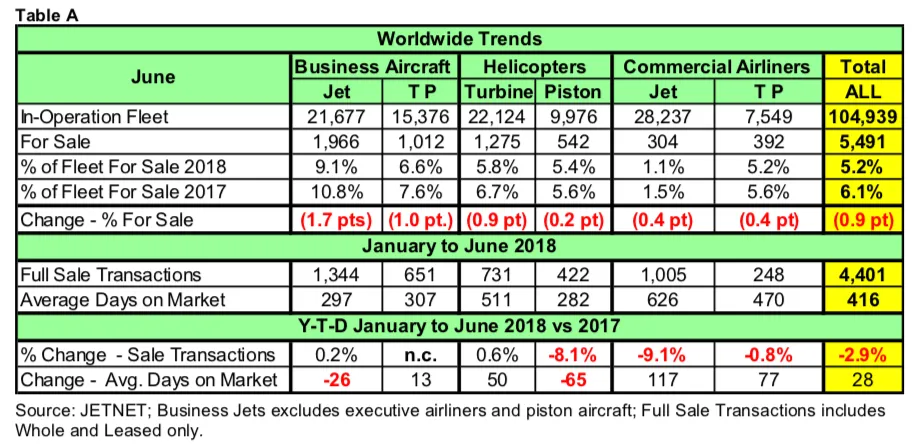
Highlighted in Table A below are key worldwide trends across all aircraft market segments, comparing June 2018 to June 2017. “Fleet For Sale” percentages for all sectors were down in the June comparisons. June 2018 was the lowest “For Sale” percentage (9.1%) for business jets since the great recession began.
TRENDS: Generally, across all six aircraft sectors reported, inventories are down, and full sale transactions had mixed results, with very little increase to no change to decreases in the first six months of 2018 versus 2017.
Business Jets are showing a flat start in the first six months of 2018, with a .2% increase in pre-owned sale transactions, but are taking less time to sell (26 days) than last year. Business turboprops saw no change in sale transactions, while taking more time to sell (13 days). Interestingly, New Business Jet shipments as reported by GAMA were also flat in the first six months of 2018 compared to 2017, at 296.
Comparing June 2018 to June 2017, turbine helicopters saw a slight increase in YTD sale transactions, up 0.6%, while piston helicopters showed a decline of 8.1% in sale transactions.
Commercial airliners are also reported by JETNET in Table A - Worldwide Trends, and include the number for sale for both commercial jets (including airliners converted to VIP) and commercial turboprops. Commercial Jets and Commercial Turboprops were down in full sale transactions, at -9.1% and -.8% respectively, in the YTD June- over-June comparisons.
For the first six months of 2018 there were a total of 4,401 aircraft and helicopters sold, with business jets (1,344) and commercial jets (1,005) leading all types and accounting for 53% of the total. The number of sale transactions across all market sectors— at 4,401—decreased by 2.9% compared to the first six months of 2017. Only pre- owned business jets and turbine helicopters showed increases in sale transactions compared to the other market sectors. However, they were both less than 1%, and business turboprops had no change.
US Real Gross Domestic Product (GDP)
The first six months flat results for business jets were surprising, because the US real gross domestic product (GDP) increased at an annual rate of 4.1% in the second quarter of 2018. In the first quarter of 2018, the US GDP increased by 2.2 percent.
As shown in Table B below, the second quarter of 2018, at 4.1%, is the second highest since 2014 (at 5.1% for second quarter results).
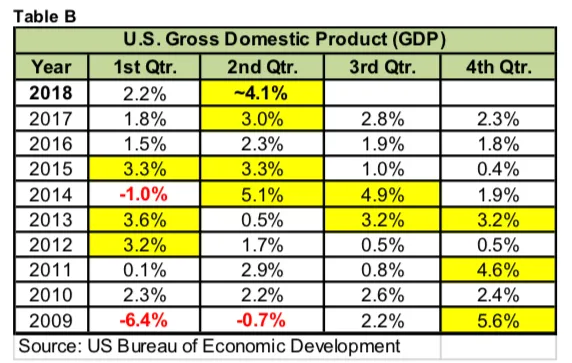
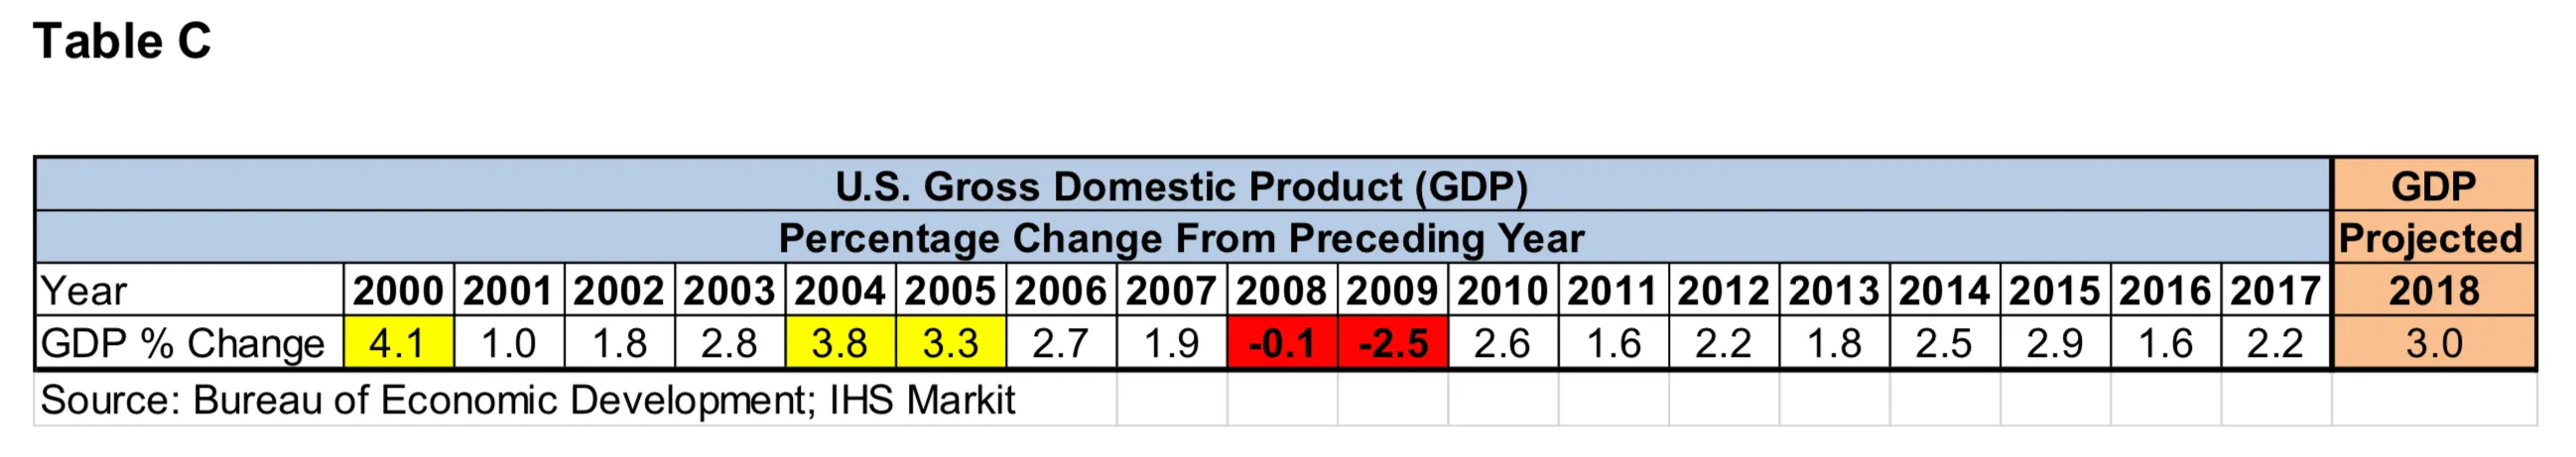
Table C below shows the yearly US GDP percentages from 2000 to 2017. The year 2017 was 2.2%, and 2018 is projected to be 3.0% for the US, as sourced from the IHS Markit Ltd. Comparative World Overview report from July 2018.
Global, USA, and Non-USA Pre-Owned Market Trends
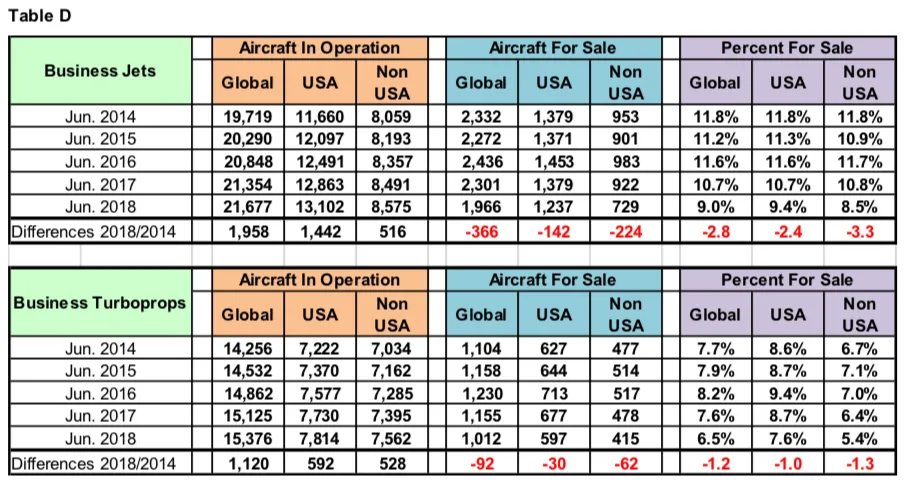
Highlighted in Table D are business jets and business turboprops, comparing the months of June from 2014 to 2018 (four years) for the USA vs. Non-USA Aircraft In Operation, For Sale, and Percentage For Sale.
The general trend has been that growth in business jets has out-paced turboprops nearly 2-to-1 in the last four years. Since June 2014, 1,958 new business jets have joined the global fleet, compared to 1,120 turboprops.
The number For Sale and Percentage For Sale have declined since 2014. The split of USA vs. Non-USA business jets in operation has remained at 60/40 levels, whereas the split of in-operation USA vs. Non-USA business turboprops is about 51/49. Interestingly, the number for sale in the USA vs. Non-USA is 63/37 for business jets, and 59/41 for business turboprops.
Pre-Owned Business Jet Transactions
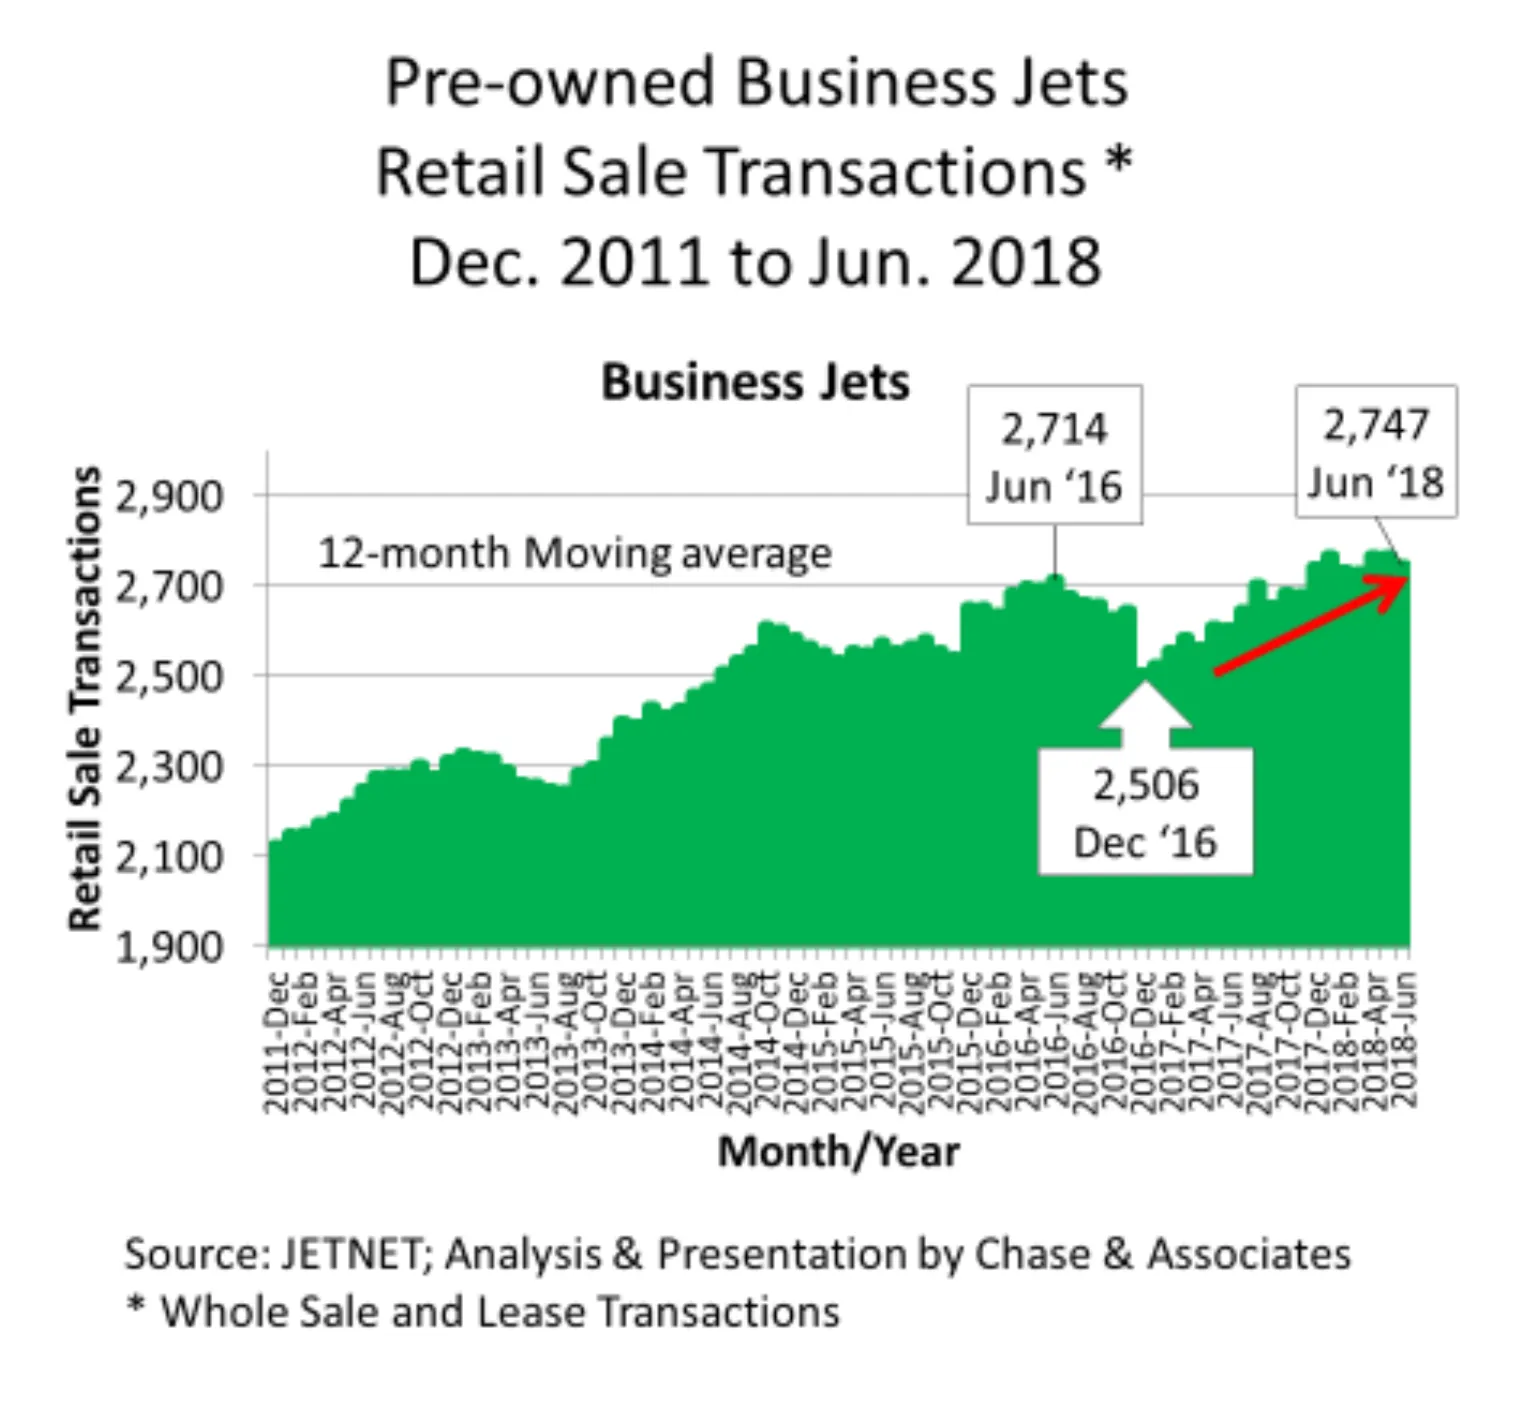
Chart A displays the 12-month moving average for Full Retail Transactions for business jets from December 2011 to June 2018.
From December 2011, used business jet transactions steadily increased until June 2016, to a high point of 2,714. A falling-off occurred in the second half of 2016, to a low point in December 2016 of 2,506, and has since steadily increased to 2,747 transactions in June 2018.
JETNET, celebrating its 30th anniversary as the leading provider of aviation market information, delivers the most comprehensive and reliable business aircraft research to its exclusive clientele of aviation professionals worldwide. JETNET is the ultimate source for information and intelligence on the worldwide business, commercial, and helicopter aircraft fleet and marketplace, comprised of more than 110,000 airframes. Headquartered in its state-of-the-art facility in Utica, NY, JETNET offers comprehensive user-friendly aircraft data via real-time internet access or regular updates.
Take A
Test Flight
Get a personalized demonstration of the world’s premier aviation intelligence platform.