Press Releases
JETNET Releases September 2019 and First Nine Months of 2019 Pre-Owned Business Jet, Turboprop, Piston, Helicopter, and Commercial Airliner Market Information
UTICA, NY – JETNET LLC, the leading provider of corporate aviation information, has released September 2019 and the first nine months of 2019 results for the pre-owned business jet, turboprop, piston, helicopter, and commercial airliner markets.
Market Summary
Highlighted in Table A below are key worldwide trends across all aircraft market segments, comparing September 2019 to September 2018. For the first nine months of 2019 there were 6,402 pre-owned jets and helicopters sold. This is a decrease of 954, or 13% fewer sale transactions compared to 2018 across all market sectors. The Piston Helicopters market was the only one to show an increase, gaining 4, or .6% more used helicopter transactions.
“Fleet For Sale” percentages for all market sectors, except for Business Jets and Piston Helicopters, were down in the September comparisons, increasing 1.5%, or 131 aircraft overall. Business Jets showed the largest increase in the percentages For Sale compared to the other markets. Business Jets For Sale percentages are at 9.8% compared to 8.9% last year at this same time, an increase of 0.9 percentage points.
The increase in Business Jets For Sale percentage shows the industry remains below the 10% mark and in a seller’s market. Inventories of pre-owned business jets for sale have increased and are now headed to the 2,200 mark as well, at 2,187 for sale.
Business jets are showing a decrease (16.9%) in pre-owned sale transactions (including leases) in the first nine months of 2019 compared to the same period in 2018. However, business jets are taking 9 fewer days to sell, 276 days on average, compared to 285 days last year. Business turboprops average days on the market increased by one day compared to last year as well, while sale transactions declined by 12.2%. Business piston aircraft are being reported in Table A as well. JETNET does not cover all piston aircraft inventory or sales. Two observations are noteworthy. The percentage for sale is more than 10%, and YTD full sale transactions are down 19.9% compared to the 2018 YTD numbers. Average days on the market for piston aircraft saw an increase of 28 days compared to last year.
Turbine helicopters showed a decrease of 9.7% in YTD sales transactions, whereas piston helicopters saw an increase in YTD sale transactions of less than 1%, at 0.6%.
Table A
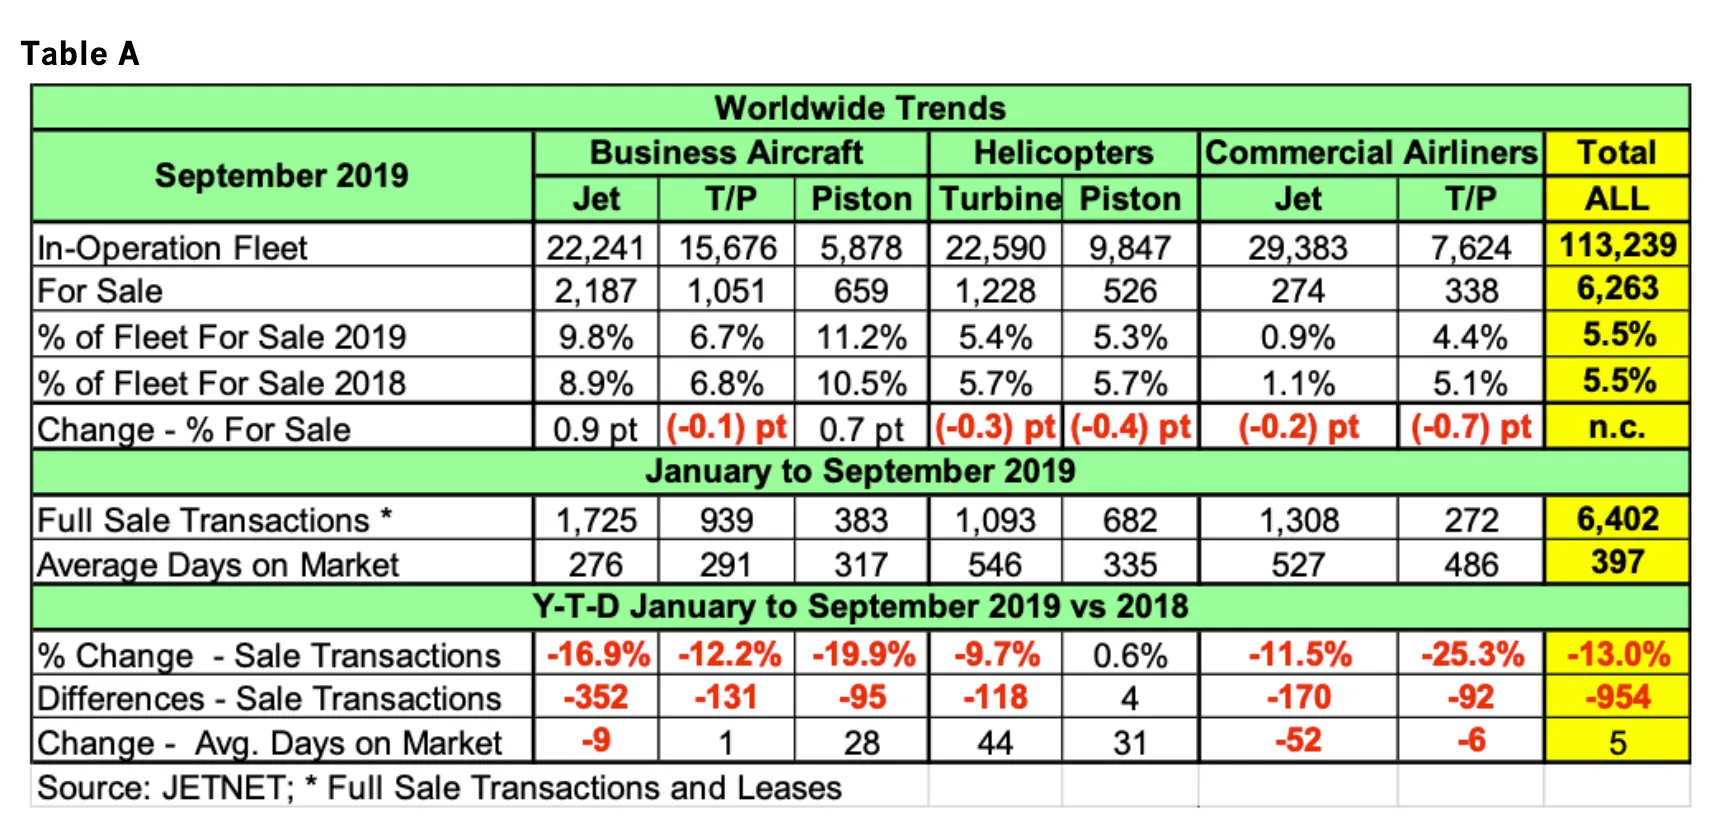
Commercial Airliners are reported by JETNET in Table A and include the numbers for sale for both commercial jets (including airliners converted to VIP) and commercial turboprops. Commercial Jet Full Sale Transactions are down 11.5% in the YTD comparisons. Commercial Jet YTD sale transactions, at 1,308, are trailing Business Jets, at 1,725 sale transactions. However, Pre-owned Business Jet, Pre-owned Commercial Jet, and Turbine Helicopter market sectors have each surpassed the 1,000 mark for YTD sales. These three sectors combined comprise 64% of the total transactions reported.
New vs. Used
As reported by the revised GAMA report, new business jet shipments were 333 (316 previously reported) in the first six months of 2019, compared to 260 in the same period in 2018. This revised report showed 52, or 18.5% more, business jets in the first six months of 2019, as Dassault Falcon Jet reported 17 deliveries not previously reported. The new business jet delivery growth in the first six months of 2019 compared to a decline of 308, or 21.5% fewer used business jet transactions. The next GAMA report is scheduled for November 13/14 and will report the first nine months of 2019.
Historically, there has been a one-year lag in new business jet deliveries versus pre-owned sale transactions. However, we find ourselves on new ground, as used inventory levels were once correlated with new sales such that most new owners needed to sell their existing aircraft before a new delivery took place. Of course, this is still true, but pre-owned inventory levels are no longer a reliable indicator of new sales. This relationship may no longer hold as true, due to the sharp decline in the realized used aircraft residual values. The price differential of new versus used has made used more attractive. However, most aircraft brokers will explain that the reduction of pre-owned sales in the first 9 months of 2019 is not so much about declining demand as it is about a lack of aircraft to choose from for the discerning buyer at the right price.
Of course, other factors are in play as well, such as when the U.S. enacted the 2017 Tax Cuts & Jobs Act into law on December 22, 2017. Under the new act, taxpayers may be able to deduct up to 100 percent of the cost of a new or pre-owned aircraft purchased after September 27, 2017 and placed in service before January 1, 2023.
This 100% expensing provision is a huge bonus for aircraft owners and operators. After December 31, 2022 the Tax Cuts & Jobs Act decreases the percentage available to depreciate qualified business jets each year, reducing it by 20% annually until December 31, 2026.
Lastly, we are now in the fourth quarter of the ADS-B Out mandate. All U.S. aircraft operated in the U.S. will require this equipage by December 31, 2019 in order to continue to operate their aircraft starting January 1, 2020. Those owners who have not equipped their aircraft with ADS-B Out will find it difficult to find new buyers.
In this market information report, used business jet transactions showed a decline of 352, or 16.9%, after the first 9 months of 2019. Of course, several new business jet models have been certified, and deliveries have taken place over the past several years. These include the Bombardier G7500 (7), Gulfstream G500 (27), Gulfstream G600 (4), Dassault Falcon Jet 8X (49), Textron Cessna Citation Longitude (2), Embraer Praetor 600 (8), Pilatus PC-24 (45), HondaJet (94; Elite 28) and Cirrus SF50 (140). Interestingly, without the inclusion of the new, low-value Cirrus SF50 Single-Engine Jet, 2018 New Business Jet deliveries would have fallen 9 percent. Note: The numbers in parentheses are in-operation, as reported by JETNET as of the end of September 2019.
U.S. GDP
Real gross domestic product (GDP) increased at an annual rate of 1.9 percent in the third quarter of 2019, according to the “advance” estimate released by the U.S. Bureau of Economic Analysis. In the second quarter, real GDP increased 2.0 percent.
Pre-Owned Full Retail Sale Transaction Trends
There were 954 (13%) fewer transactions in the first 9 months of 2019 compared to 2018 across all market sectors. This decline has continued since January 2019. It was not expected, as the U.S. GDP increased 3.1 percent in the first quarter of 2019, but that GDP growth slowed in the second and third quarters of 2019 as noted above.
When economic conditions are favorable (3.0 percent U.S. GDP growth or greater), both new and used do well.
12-month Moving Average Retail Sale Transactions Analysis
Chart A displays the 12-month moving average for full retail transactions for business jets from January 2012 to September 2019.
From January 2012, used business jet transactions steadily increased until June 2016, to a high point of 2,725. A falling-off occurred in the second half of 2016, to a low point in December 2016 of 2,531, and had steadily increased to 2,908 transactions in December 2018. However, since January 2019, the 12-month moving average for full retail transactions for business jets declined to 2,556, or 16.9%, by September 2019.
This decline is only slightly above the low point recorded in December 2016, at 2,531 full sale transactions. Accordingly, 2019 is off to a bad start for the pre-owned business jet market.
Chart A - Business Jets Market
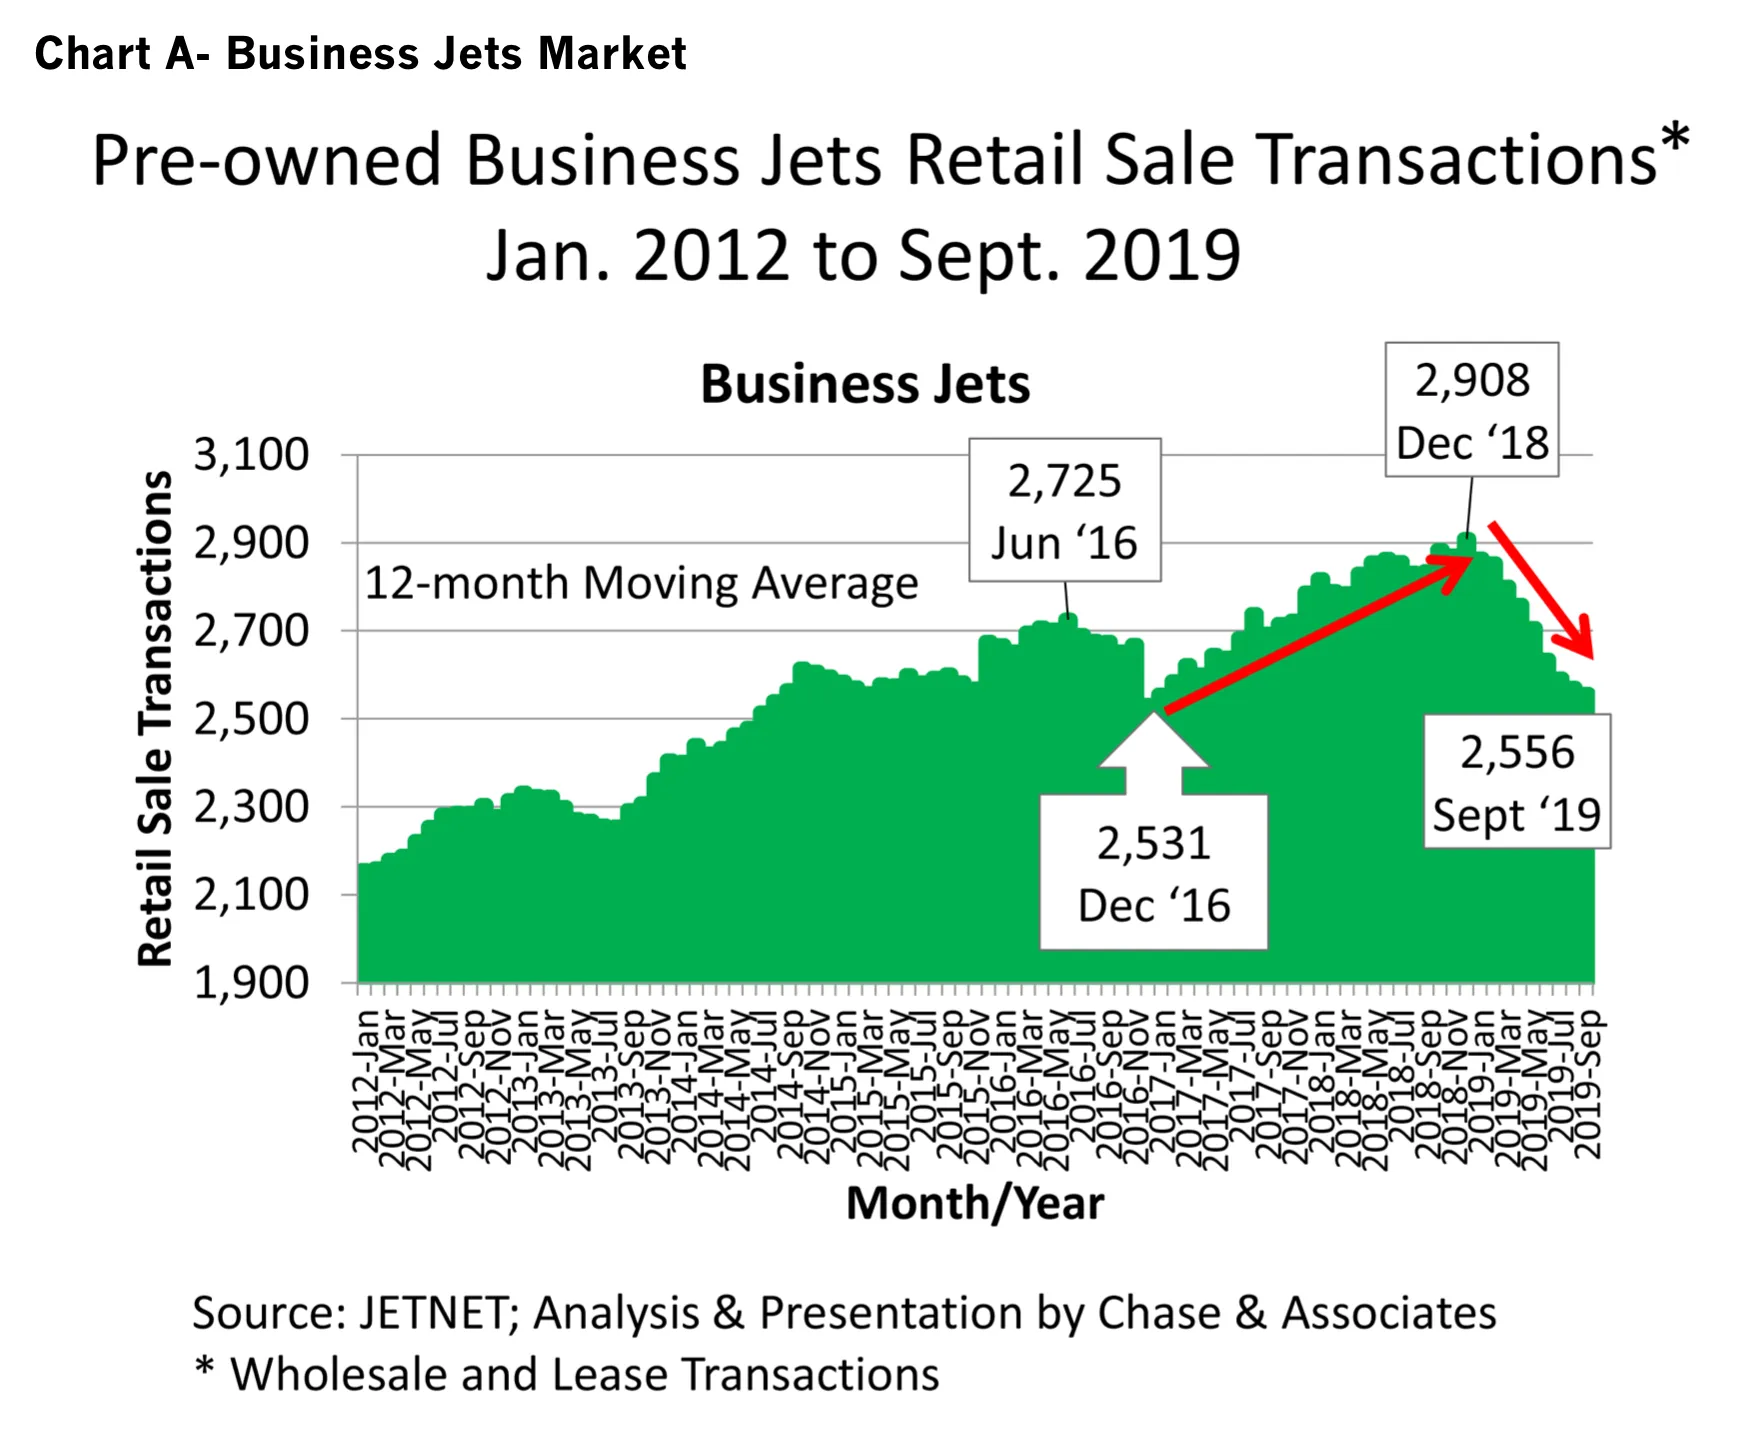
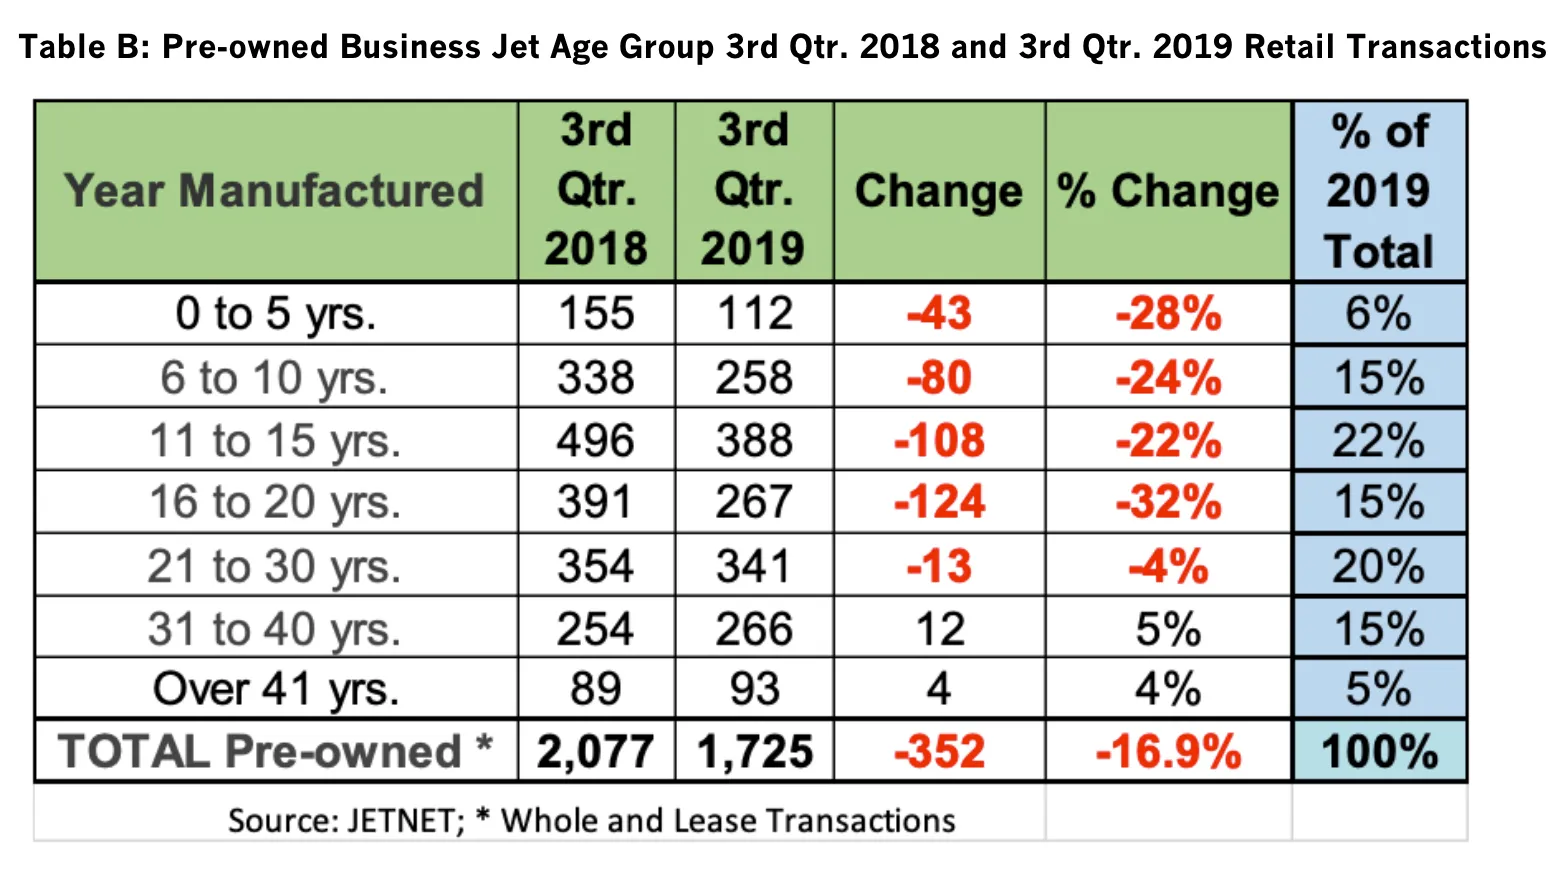
Table B shows Pre-owned Business Jet Retail Transactions (Whole & Leases), comparing third quarter 2018 and third quarter 2019 by age grouping. There were 352, or 16.9%, fewer Pre-owned Business Jets sold.
Two observations:
-
Aircraft aged 31 to 40 and over 41 years saw increases in retail transactions
-
Aircraft aged 0 to 30 years saw declines in the number of business jets sold, ranging from 13 to 124 fewer aircraft. Those 0 to 5 years and 6 to 10 years, while representing only 21% of the total of 1,725 sold transactions, declined by 123 business jets sold in the YTD comparisons.
Table B: Pre-owned Business Jet Age Group 3rd Qtr. 2018 and 3rd Qtr. 2019 Retail Transactions
As the leading provider of aviation market information, JETNET delivers the most comprehensive and reliable business aircraft research to its exclusive clientele of aviation professionals worldwide. JETNET is the ultimate source for information and intelligence on the worldwide business, commercial, and helicopter aircraft fleet and marketplace, comprised of more than 113,000 airframes. Headquartered in its state-of-the- art facility in Utica, NY, JETNET offers comprehensive, user-friendly aircraft data via real-time internet access or regular updates.
Take A
Test Flight
Get a personalized demonstration of the world’s premier aviation intelligence platform.